SMILE LAST MILE

Suburban areas face different first & last mile issues than big cities because in suburbs people rely more on motor vehicles to travel to public transit access points. In San Francisco Bay Area this behavior has caused parking shortage for 2 commuter rails: BART and Caltrain. It has also decreased public transit ridership and worsened highway traffic when parking lots are filled quickly in the early morning.

This first seemed to be a Park-and-Ride issue. But after studying the theories and community patterns it turned out a more comprehensive first & last mile solution is needed, to fundamentally solve parking issue but not to increase traffic comes to park.

Hence a flexible and multifaceted model, Smile Last Mile, which utilizes cloud computing, Web & mobile technologies, GPS, relative localization and existing NFC facilities is proposed here.

It is first for Fremont and BART (Bay Area Rapid Transit) and ultimately for Bay Area and more.


Go to Project

About City of Fremont

A suburban city in San Francisco East Bay Area, California, United States

BRIEF HISTORY

History of the Fremont area began in 1795, when Mission San José was founded by Spaniard. The area grew rapidly at the time of the California Gold Rush with agriculture dominated the economy. Fremont became more industrialized in the 1953 to 1962. A boom in high-tech employment in the 1980s to the late 1990s caused rapid development and and linked the city with Silicon Valley.

FREMONT NOW

As Fremont creates plans for growth, city leaders and developers are taking into account suburban development trends:

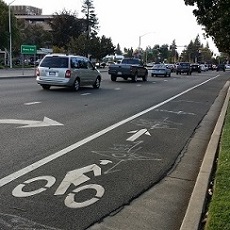
  • As suburbs become more urban, smart growth is key
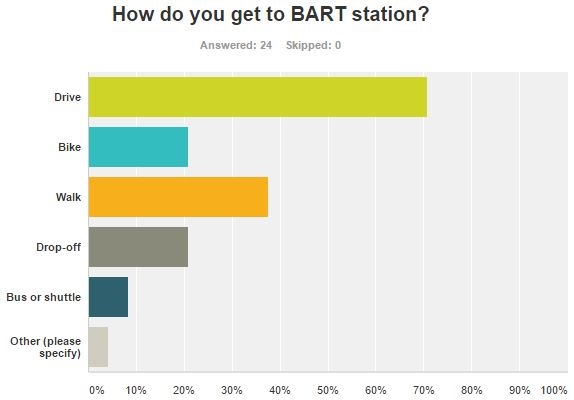
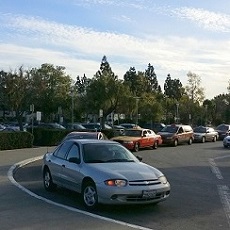
  • "Drive-everywhere-for-everything suburbs" are going to become less competitive
(click on the images to view sources or more details)


Located 40 miles southeast of San Francisco and 20 miles northeast of San Jose, with a population of around 220,000. Fremont is the 4th most populous city and the largest suburb in the metropolis, known for family-friendly neighborhoods but also home to many tech companies generally linked to Silicon Valley.
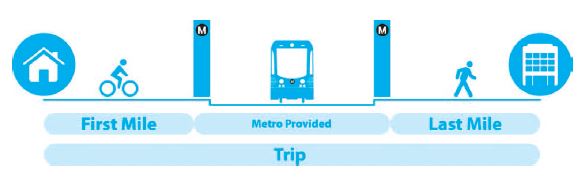
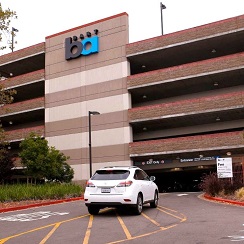
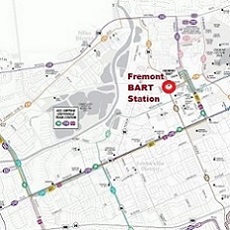
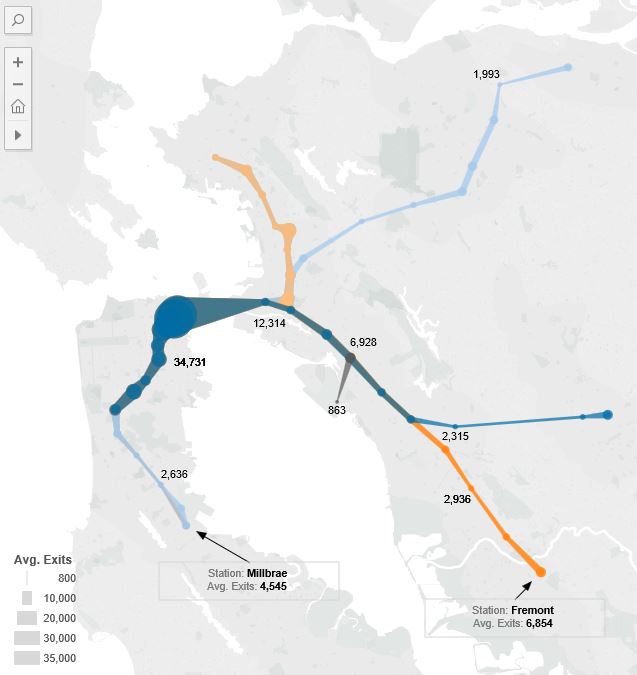
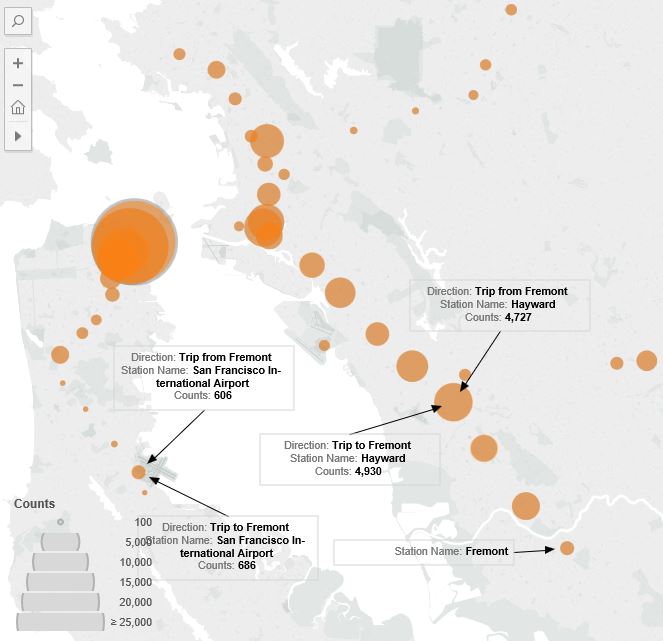
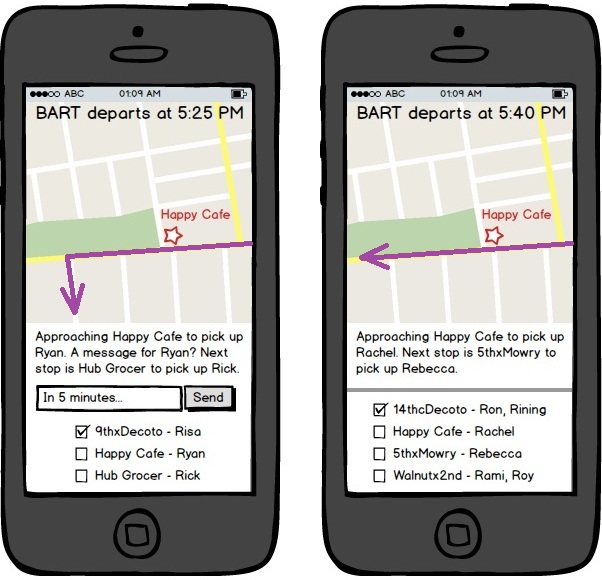
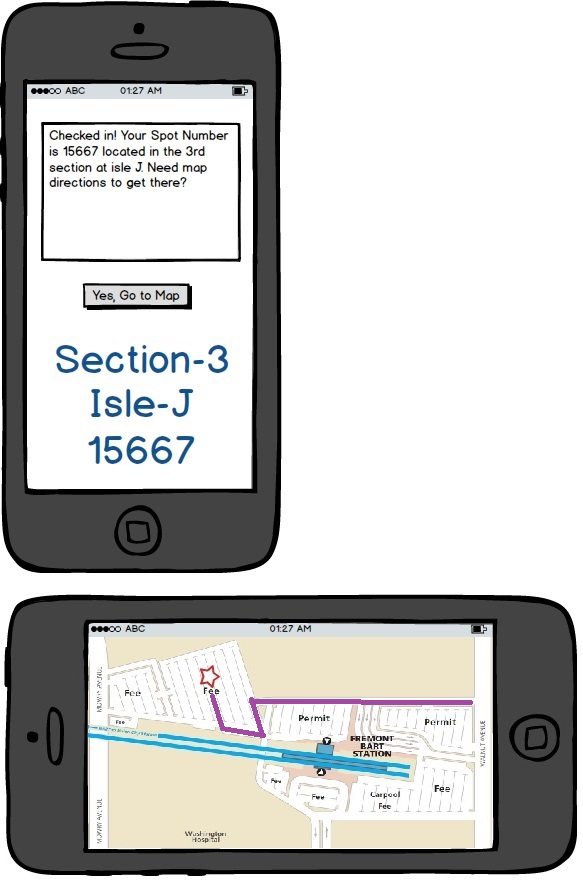
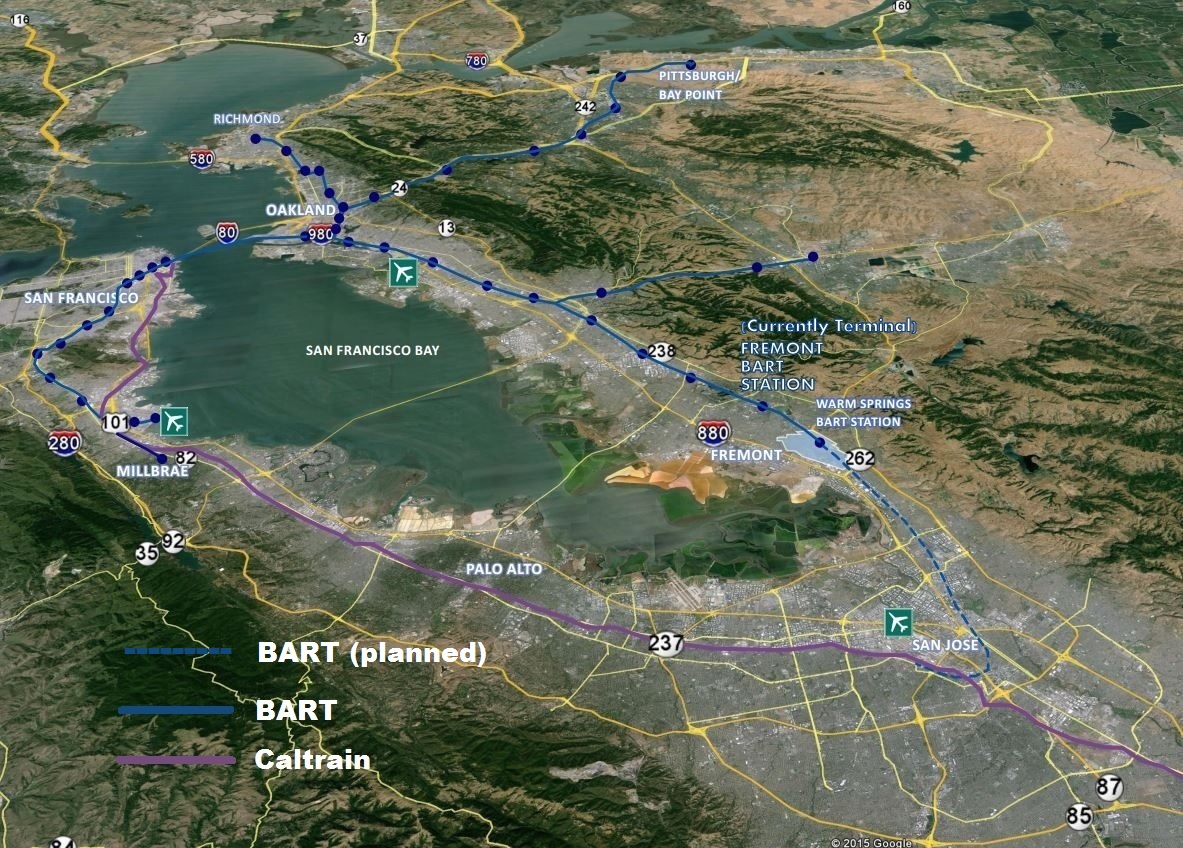
Several unique assets: a centralized location, vast unoccupied land, accessibility to BART (Bay Area Rapid Transit), etc. Fremont BART Station is currently a terminal transit hub and the new Warm Springs Station will open in 2016. Expansion to San Jose to connect with Caltrain is planned to close the transit loop for the entire Bay Area.
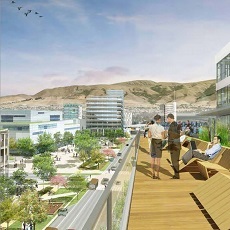
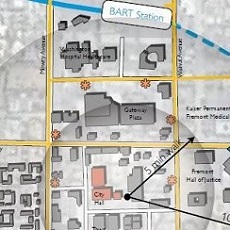
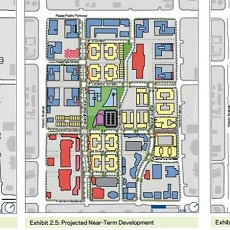
Fremont's Downtown district is a 110-acre business, services and residential area adjacent to Fremont BART Station. A mixed-use community plan has been kicked off to add residential units, ground-floor retail space, office space and public plaza. It aims to create a more urban, pedestrian-friendly downtown core for the city.
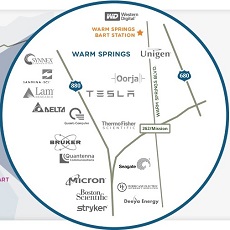
Warm Springs district, located 7 miles southeast of Downtown and bounded by 2 major highways, currently houses many industrial tech companies. The city is kick-starting an 850-acre "Innovation District" development, surrounding the new Warm Springs BART Station. Planning to add offices, hotels, entertainment, public facilities, housing units, retail spaces and schools.


Analyzing First & Last Mile Issues

If it's a hassle to reach the stations, how could people truly utilize public transportation?

FIRST & LAST MILE

A trip is the entire journey between origin to destination. Individuals may utilize multiple modes of transport to complete the journey. Public transit may frame the core of such trips, but users must walk, bike or drive to the nearest station which is referred as first & last mile. This project is focusing on the trips between homes and BART station in Fremont which is both first & last mile. (click on the image to view source)

ONLINE RESEARCH & COMMUNITY ENGAGEMENT

The issues' severity, impact scope and current responses were mostly researched online. BART riders' behaviors and local development were researched via community engagement: survey and city meeting. My resident survey distributed on Nextdoor.com helped discover more real problem senarios. At the city meeting, discussion with the mayor, county advisor, BART board and city engineer helped understand the reality in funding, processes, impediments, etc and city planning alignment. All together frame the analysis depicted below.

PARK-AND-RIDE WOES

As a terminal hub, Fremont BART Station draws traffic from further areas which has worsened parking shortage. While there is reserved parking and city overflow parking, most still chose to try their luck with first-come-first-serve. What's the reason? (click on the images to view the sources or more details)
According to BART, most lots are filled by 9:00 AM. Latest update indicates the estimated parking fill time of Fremont BART Stations is - 6:30 AM. And 32 out of BART's 33 lost has long waiting list for reserved parking.
BART has also been experimenting with sensors at 2 stations. Several sensors are installed at least wanted spots to indicate if the lot is full, but drivers still need to circle in the garage to find a spot.
There is Carpool to BART priority parking. But the survey found that no one is carpooling because it's too hard to coordinate with a partner.
In Fremont, BART's parking area is no bigger than nearby hospital or shopping mall's. An overflow BART parking is not widely known and it's 0.6 mile away from the station. Businesses set up warnings to prohibit overflow BART parking.

NOT-REALLY LOCAL ALTERNATIVES

According to the multiple-selection survey, even if there are other options, the major way to get to BART is still driving. Why don't they walk, bike or take a bus to BART? (click on the images to view the sources or more details)

WALK

Oversized street blocks around BART station (as long as 1,425 feet), and broad and underutilized streets have been limiting pedestrian circulation. And the majority don't live close enough to BART and walking is not feasible.


BIKE

Again the majority just don't live close enough. Although there are bike lanes but cyclists need to share a lot of portion with vehicles which is not safe. Not enough secured bike lockers is one reason prohibiting biking too.


DROP-OFF

The option when carrying luggages or in a hurry. But many don't have friends or families to help. And according to one respondent: "It's a $10 Uber ride from my house ($20 both ways). It's hard to justify when parking is only $3." Drop-off is a convenient but luxury option, and it isn't helping too much to reduce traffic or carbon footprints.


BUS OR SHUTTLE

Should be more feasible as the majority don't live close enough. But in reality no one took a bus to BART. One respondent said: "Buses in the suburbs are a joke. They only run once an hour. And they take forever." While AC Transit Bus is cutting lines and schedules due to dropped ridership, it's making it even harder for people to take buses. A bad cycle.

NOT SIMPLY MORE PARKING AREA

Currently BART riders make more than 400,000 trips on a weekday, and there are only 46,385 parking spots. To add more parking area, funding and land acquisition are difficult. BART isn't inclined to build more parking structures. City of Fremont has kicked off planning to transform districts adjacent to BART stations to be more pedestrian-friendly. Both authorities are looking to develop innovative solutions to alleviate the shortage.

Furthermore, too much parking space is not good to a city. Donald Shoup, a professor of planning and author of The High Cost of Free Parking: "Parking minimums distort transportation choices toward cars, and thus increase traffic congestion, air pollution, and energy consumption. They reduce land values and tax revenues. They damage the economy and degrade the environment. They debase architecture and urban design. They burden enterprise and prevent the reuse of older buildings. And they increase the prices for everything except parking."

Building parking structures or even smart apps to find parking are both encouraging transportation choices toward cars. Both are not doing good to a city, making other options more underutilized and it's not preferred for both BART and City of Fremont. So a more efficient and proactive first & last mile model to solve parking shortage by reducing driving will be needed.

Open Data Analysis

Beside qualitative analysis, more quantitative insights from open big data

TRANSIT DATA 0

Focusing on first & last mile solutions, I first thought to get data from Clipper Card. It is a reloadable contactless smart card (NFC technology) used to pay for multimodal transits in Bay Area including rail, bus, ferry and parking. But note that BART ride can be paid with Clipper Card, but not BART parking as of now.

However unfortunately, Clipper Card doesn't publish any usage data as of now. Although no open data is provided, this flexible payment system will definitely play a key role in my smart model proposal.

TRANSIT DATA 1

The next best choice of open data is BART's ridership report. Here I am visualizing two sets of data (not raw sets, data wrangling was needed) to compare Fremont and other stations. Please note:

  • Each chart below is a static partial of the entire interactive dashboard. Please click on the image to go to Tableau Public for full view.
  • If Tableau's page doesn't show up properly, just refresh a couple times.
  • BART provides ridership report but no detailed entry/exit logs. The best precision I can get is monthly data.

BART AVERAGE WEEKDAY RIDERSHIP

First chart shows the average count of exits by line and station on a weekday (non-weekend). A disproportionate number ridership concentrated at 4 downtown stations in San Francisco. Some terminal stations like Fremont do draw more traffic. In 1999, the average exits of a weekday at Fremont was 5,423 and in 2015 it's 8,905; overall average 6,854 (click on the image to go to Tableau for more details).

BART simple system carries people from the vast suburbs especially East Bay into downtown. As East Bay is growing recently, a smart first & last mile model for BART will play an important role to help these suburbs grow more sustainable.

WEEKDAY RIDERSHIP FROM/TO FREMONT

Second chart shows the total count of trips from or to Fremont of the past 12 months. The symmetrical numbers may indicate that most people took BART for round trips. And interestingly, besides the busy downtown stations, people actually traveled in between cities in East Bay via BART (click on the image to go to Tableau for more details).

If the smart first & last mile model for BART can be established in these suburbs, they can be more integrated and grow into a inter-supporting living community.

Smart Model Design

To help BART riders easily complete first & last mile of the trips

SMILE LAST MILE

Smile Last Mile, not a single app but a multifaceted, flexible, scalable and portable model that utilizes cloud computing, mobile devices, GPS, relative localization and existing NFC facilities to enable transit riders to complete the first & last mile of the trips efficiently.

This model is proposed based on 2 important observations from the above research of city planning and current issues:

  • Because of built environment, motor vehicles are still essential for suburban living at least for the next couple decades even city is transforming to a more pedestrian-friendly style
  • But it's essential to reduce unnecessary and unwated traffic on the roads, to make the transformation happen, for suburb's sustainability
The very first goal of Smile Last Mile model is to reduce cars from/to Fremont BART Station and reduce parking traffic inside. The design can be divided into 3 parts:

  • Crowd-based first & last mile ride-sharing
  • No-hassle Park-and-Ride information system
  • Center of computing and analytics

CROWD-BASED FIRST & LAST MILE RIDE-SHARING

SMILE RIDER

  • Registered BART riders use mobile app to plan for future BART rides
  • On travel day cloud services find a Smile Driver/Bus match
  • Mobile app displays a pick-up Smile Hub and waiting time
  • Smile Riders use linked Clipper Card via app to pay for the ride
  • The round-trip price should be no more then daily parking fee

SMILE DRIVER

  • Approved BART riders can register as Smile Drivers
  • Smile Drivers use mobile app to plan for BART rides by parking type (long-term, monthly, daily)
  • On travel day cloud services generate optimized route to pick up Smile Riders
  • Smile Drivers only stop at Smile Hubs on the way
  • Smile Drivers get points and can exchange points for Clipper Cash or parking priority

SMILE BUS

  • A mini bus operated by a contracted company or individual
  • Cloud services group a list of Smile Riders to pick up/drop off
  • Doesn't go fixed route but takes directions from cloud services
  • Smile Buses only stop at Smile Hubs on the way
  • Smile Bus is available for group rental and special arrangement
  • No monopoly, there are multiple end operators up for community review

SMILE HUB

  • Simply a pick-up/drop-off location
  • To keep privacy, maintain efficiency, connect community and reduce carbon footprints
  • Neighborhood business (e.g. café, grocer) can register as a Smile Hub
  • Or it can be a safe corner where people can easily walk to
  • Not permanent, it's adjusted by suggestions and analytics
  • Smart Riders/Drivers get Smile Hub adjustment updates

NO-HASSLE PARK-AND-RIDE IFORMATION SYSTEM


PRIOR PLANNING

  • Mobile and Web interfaces for parking planning
  • Reserved parking waiting list prediction
  • 24-hour-prior parking fill time prediction
  • All-day-real-time availability report, enabled by NFC check-in
  • Rport future non-driving days to free up spots and get points

SMART ASSIGNMENT

  • At entrance, touch Clipper Card or NFC phone to get the spot number
  • Spot number will be displayed on NFC screen or mobile or sent via text message
  • Mobile GPS map to guide to assigned parking spot, relative localization can be installed for better precision
  • Payment deducted automatically at check-in (now cash only)

EASY ALTERNATIVES

  • Adjoint function of real-time parking availability report
  • GPS directions to nearest overflow parking with Smile Bus waiting time. Or find a Smile Driver/Bus match for pick-up
  • Overflow parking thus can be placed closer to highway for riders from far away and reduce downtown traffic

CENTER OF COMPUTING AND ANALYTICS

RIDE-SHARING SERVICES

  • Cloud computing services respond to Smile Riders and Drivers' planning activities
  • Compute to find the best Smile Rider/Driver/Bus matches
  • Compute to find the best Smile Hubs and routes
  • Log all activities

PARK-AND-RIDE SERVICES

  • Cloud services respond to Park-and-Ride planning and parking entries and exits
  • Compute to find next priority rider when spot is opened up
  • Compute to assign the best parking spot for each car entry
  • Log all activities

TRAFFIC ANALYTICS

  • Analyze big data collected by previous 2 services sectors
  • Predict ride-sharing pattern and plan for peak usage
  • Predict parking pattern and plan for alternatives
  • Also to understand patterns to use public transit (e.g. where the BART riders live)

CITY INSIGHTS

  • Ride-sharing analytics can be used for road and land-use planning
  • Parking analytics can be used for security planning
  • Combining other data for more insights
  • The results should be publicized for review as the model is majorly grown by peers in the community

SYSTEM ARCHITECTURE

Above elements will be distributed over the internet. A conceptual architecture is depicted below. (enlarge to see more details)

FEASIBILITY & POTENTIAL

Smile Last Mile model's 4 major characteristics will be enabled by many existing possessions and some new technology development. So it will be a very manageable project investment:

  • Multifaceted: Besides Smile Hub and Smile Bus, this model inserts a new interface among BART riders (Smile Rider/Driver) which can be enabled by existing expandable Clipper Card payment system and the new cloud computing services and mobile apps that are universally mature.
  • Flexible: There will be initial development cost but no huge fixed cost. Crowd-based ride-sharing, dynamic planning and activity prediction will increase service precision without acquiring lots of equipments and facilities.
  • Scalable: Local community plays a key role in this model. And when more users enter this semi-peer-ro-peer model, the system becomes more powerful automatically. Public transit ridership, city economy and Smile Last Mile model can help each other to achieve organic and smart growth.
  • Portable: This model is mostly software and crowd based; only minimal additional NFC and relative localization devices will be required. Hence it can be "ported" to other stations or transit systems more quickly.
When the first Smile Last Mile model succeeds,

  • The data collected can help participating cities to grow more efficiently and sustainably.
  • The model can be amended to include first & last mile not only to public transit but also many other hubs of commerce, education, community, etc.
  • In the long run, traffic reduction can gradually reshape suburban scape. Tranquil living style will be maintained with more efficient land use.

USE CASES & WIREFRAMES

Below are key public interfacing use cases and corresponding wireframes for a concept of how it will work in reality. (click on the images to view full-size mockups)

Smile Rider can enter future trips from home to BART or vice versa. The records will be stored and cloud services will match other Smile Riders for Smile Driver/Bus ride-sharing. A calendar is available for trip updates.
A ride-sharing can be requested as late as 30 minutes ahead. Smile Rider can pick the best Smile Hub if there are multiple matches. Waiting time is the time to shop too.
Depends on Smile Rider's exact location, a reminder will pop up before BART's departure and display the ride-sharing match. Smile Rider can then walk to Smile Hub for pick-up.
Smile Driver/Bus will see the pick-up list and optimized route before BART's departure.
When driver touch NFC for parking check-in, a dynamically assigned spot number will show up to eliminate the need to circle around. A map and directions will be provided too. Driver later can refer to this record and map location to retrieve the car.

Conclusion

What's learned and what's planned

SIMILAR BUT DIFFERENT

While researching online, I noticed that Lyft, one of the transportation network companies smaller than Uber, has been working on a similar strategy which Lyft CEO Logan Green describes as a third category of transportation somewhere between public and private. Green envisions drivers using it to pick up passengers along their own commutes, school runs, or trips to the store. And just a month ago in October Lyft launched its first formal integration with Dallas Area Rapid Transit's GoPass mobile ticketing as the company's data showed that 25 percent of Lyft riders used the service to connect to public transit, .

But differently, my model design is more rooted in the community. After learning parking problem reality, bad impact of parking, community experience and expectation and suburban planning trends. Instead of focusing on a tech-driven solution that can cause more bad traffic impact, I proposed a design that encourages more community collaboration and traffic reduction and is very feasible by embracing existing infrastructure and human resources and mature cloud, mobile, GPS and NFC technologies.

Initially using Smile Driver points as incentives to encourage ride-sharing, justify parking rights and remit transit costs. Parallel Smile Bus creates easier to enter new business opportunities. Existing local businesses first involve as Smile Hubs which is also a way to market themselves. If ridership rises due to easier first & last mile travel, BART can raise more income for renovations, local businesses too will thrive with more potential customers. While land used for cars and parking can be redeveloped into public plaza or walkable space, more human-friendly environment will keep more good human traffic. Yes this project will require government involvement but the tax money should eternally come back to the better future of the community.

The project was initially aimed to solve park-and-ride woes but interestingly in the end became a model for better collaboration and sharing. Which for me is a very enlightening experience to learn more about my local community and how many positive opportunities it can embrace. "Community" or the Latin "communitas", means "coming together with gifts." Yes we can share more and have more.

References


ABOUT CITY OF FREMONT

OPEN DATA ANALYSIS | SMART MODEL DESIGN

CREATIVE CREDITS

All the images and graphics used are extracted from the sources with links provided or created by the project author, if not otherwise specified.